Uptime Kuma
What this is
The Uptime Kuma integration connects PiHerder to an existing (or template-deployed) Kuma instance so monitor status, TLS days, and bindings show up on servers, Docker, Dashboard tiles, and the fleet Services grid.
Why it exists
Kuma is excellent at HTTP/TCP checks; PiHerder is excellent at fleet actions. Connecting them avoids a second mental model: when something is down or TLS is expiring, you see it next to the host that owns the service — and can jump into Kuma or the Docker page in one click.
You can deploy Kuma via Templates, then connect the integration for status and bindings.
End-to-end: Kuma → fleet Services
- Run Kuma (template or existing) and create an API key.
- From a host that can reach Kuma, probe metrics (optional sanity check).
- Catalog → Integrations → + Uptime Kuma — URL + key → Test / Poll.
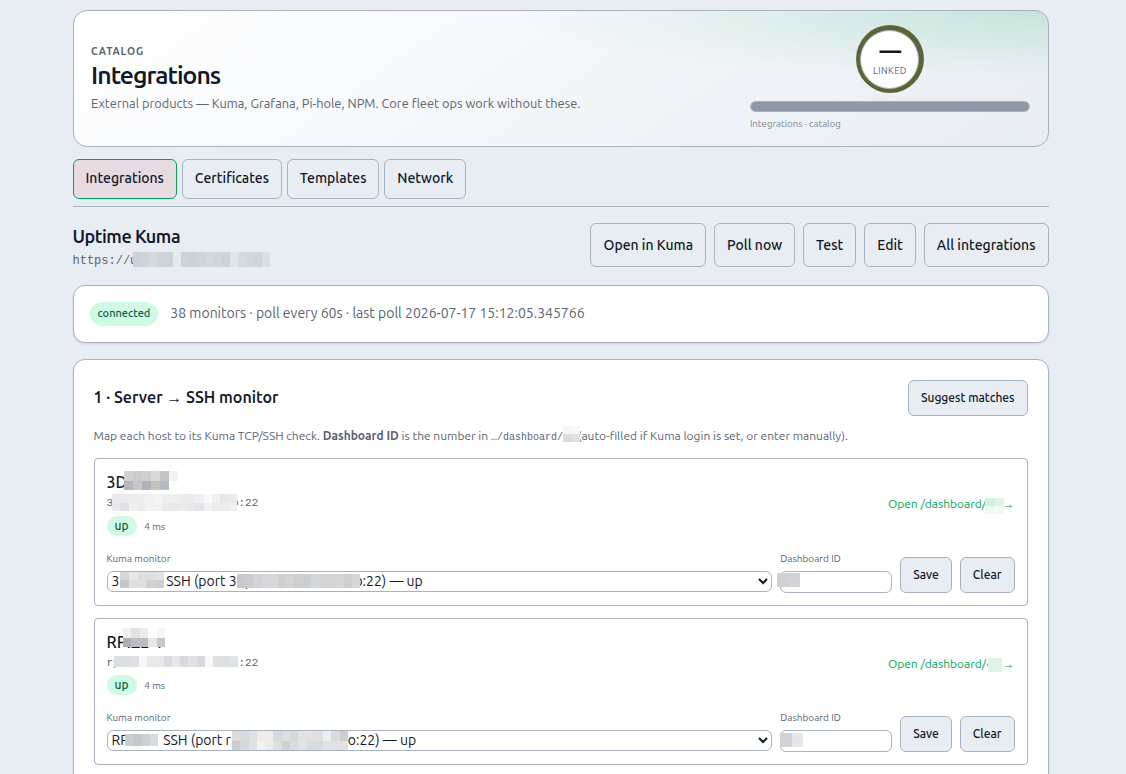
- Bind monitors (SSH, host service, or Docker) or Suggest matches.
- Open
/servicesand filter Down / TLS issue. - Optional: enable Web Push for Integration monitor down.
Monitor inventory on the integration detail page is a dense list (name, status, type, target, TLS days, latency) — one layout on phone and desktop.
Connect
- In Kuma: Settings → API Keys — create a key (copy once).
- From a host that can reach Kuma:
- PiHerder → Catalog → Integrations → + Uptime Kuma — base URL + API key → Save.
- Optional (recommended on Kuma 1.23): username/password for dashboard ID map (
/dashboard/{id}). Metrics often omitmonitor_id. - Poll interval default 60s; Test / Poll now.
Binding scopes
| Scope | Where you see it | Why bind that way |
|---|---|---|
| SSH reachability | Server chips, detail, Services | Host alive vs app alive |
| Host service (no Docker) | Server detail, Services — e.g. HAOS | Non-compose apps |
| Docker project/container | Docker chips + Services | Stack-level status |
- Suggest matches maps unbound servers to TCP/SSH monitors.
- HTTP monitors expose TLS valid + days remaining.
- Down transitions → in-app notifications (+ optional Web Push: Integration monitor down).
Services UI
| Path | Purpose |
|---|---|
/integrations | Connect + bind |
/servers/{id}/services | Per-host services |
/services | Fleet icon grid — filter All / Up / Down / TLS issue, search by name/host/location, App / Kuma / Host / Docker links |
| Dashboard | Services count tile → /services |
Empty fleet grid explains how to bind Kuma monitors. Prefer fixing down or TLS filters first when something looks wrong.
Logos
Auto favicon fetch + manual upload under DATA_ROOT/service_logos/ (./piherder_data).
Related
- Dashboard & Services
- PWA & Web Push
- Move a service — service bindings follow dest by compose project (even if the bind still sat on an older host). IP-based monitors are a checklist (no Kuma write API). A
docker.sockbind is not copied — dest uses dest’s socket.