Grafana
What this is
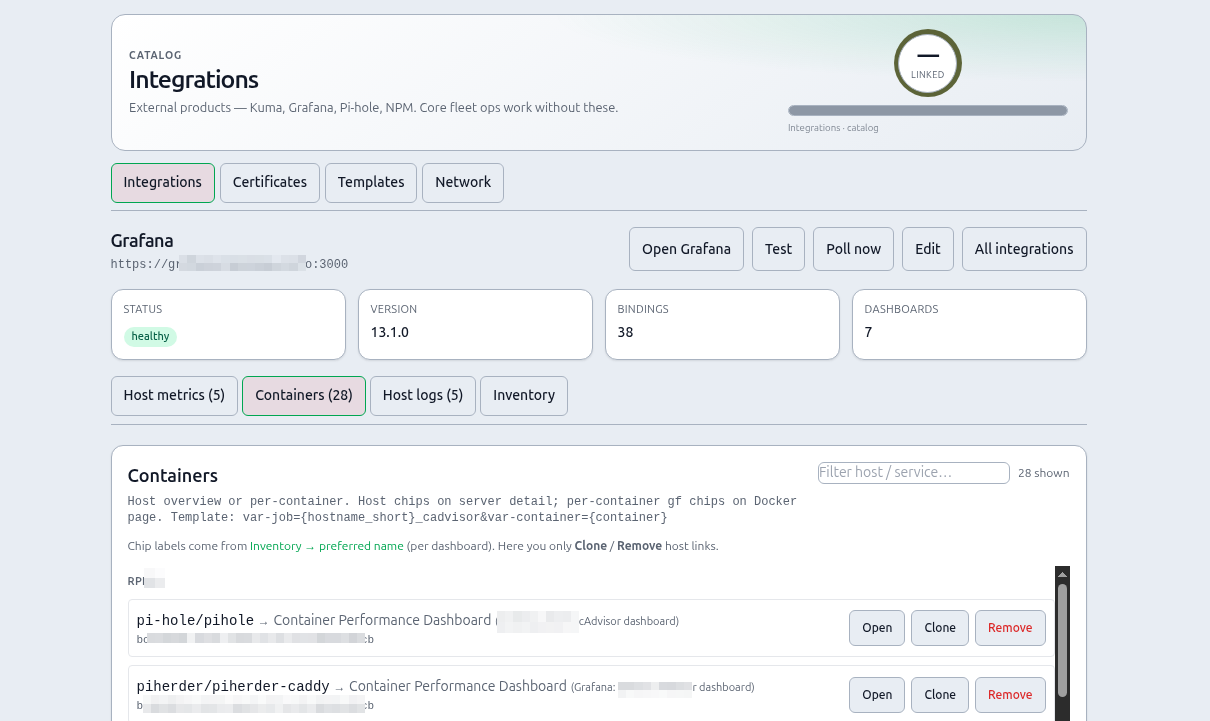
A read-mostly integration that inventories Grafana dashboards and places deep links (chips) on server and Docker pages — with optional preferred names and query templates.
Why it exists
Metrics usually already live in Grafana. PiHerder should not re-implement host CPU/disk/container graphs. Backup dest, OS patches, LAN census, Docker deploys, and console sessions never appear in Grafana — those live on Reports.
PiHerder does not have to deploy Grafana (you may still use the Grafana template for a new instance).
End-to-end: chip on a server
- Create a Grafana service account Viewer token.
- Connect integration (URL + token) → Poll for inventory.
- On Inventory, set preferred chip names if titles are noisy (dense list — one card per dashboard).
- Bind a dashboard as Host metrics (or Containers / Host logs).
- Open the server detail Grafana card → chip opens the filtered dashboard.
- For container-scoped binds, confirm the Docker page chip appears.
Connect
- Grafana → Administration → Service accounts — Viewer token (
glsa_…) recommended. - Probe:
curl -sS -H "Authorization: Bearer $GRAFANA_TOKEN" "https://grafana.example.com/api/health"
curl -sS -H "Authorization: Bearer $GRAFANA_TOKEN" \
  "https://grafana.example.com/api/search?type=dash-db" | head
- PiHerder → Catalog → Integrations → + Grafana — base URL, optional token, query templates (
var-prefix). - Poll / Test stores health + inventory (with token).
- Poll for inventory, then open the Inventory tab to set preferred chip names (optional).
- Bind with a kind (Host metrics / Containers / Host logs):
| Kind | Surfaces |
|---|---|
| Host metrics / Host logs | Server detail Grafana card |
| Containers (host) | Server detail Grafana card |
| Containers + container name | Docker page chip / ⋯ / expand |
Preferred name (Inventory) & remove (bindings)
Chip labels can differ from Grafana’s dashboard title:
- Preferred name — set on the Inventory tab dense list (one field per dashboard UID). Stored on the Grafana integration (
config_json.display_names[uid]). - Applies to all existing host binds of that UID and any new binds later.
- Survives Poll (Grafana title kept as reference).
- Blank + Save clears the preferred name → chips follow the Grafana title again.
- Binding tabs (Host metrics / Containers / Host logs) — Clone / Remove only (no rename).
- Remove deletes that host/container link only; preferred name stays for other hosts and future binds.
Placeholders
{hostname}, {hostname_short}, {container}, {project}, {ip}, …
Grafana variables need the var- prefix (var-job=…).
Docker UX
- Grafana chip (tap opens filtered dashboard)
- Container ⋯ menu
- Expanded row links (mobile-friendly)
Without a token you can still deep-link by pasting dashboard UIDs; inventory list will be empty.
Move a service
Move a service rebinds Containers (project or container) dashboard chips onto dest so the Docker page still shows Grafana. Host metrics / Host logs chips stay on the old host — those are host graphs, not the moved stack.
Related
- Reports — PiHerder job / scan / console history (not host graphs)
- Dashboard & Services
- Move a service