Reports
What this is
Reports (/reports) is PiHerder’s own history: how backups, OS patches, the LAN census, Docker deploys, and the web console actually went over the last 7 / 30 / 90 days.
Grafana will never know this. It never sees rsync dest size, backup success/fail, apt apply counts, nmap hosts_up, compose deploys, or console session time.
It is not a second status dashboard and not a set of jump-chips. Open Dashboard for “what needs care right now.” Open Reports for “how did this week / month go?”
Why it exists
| Question | Where |
|---|---|
| Host CPU, disk, container graphs | Grafana chips on the host |
| Who needs patches or has a service down today | Dashboard |
| Backups succeeded vs failed? Is dest growing? | Reports → Backups |
| OS patches applied per host per week / month / year? | Reports → OS patches |
| How many LAN devices were live each day? | Reports → LAN live |
| Docker deploys / image patches ok vs fail? | Reports → Docker |
| How much web console was used (sessions, privileged, duration)? | Reports → Console |
Sources: Jobs (and the JSON each job stored), nmap scan runs (hosts_up), and Audit (ssh_console_open / close). No SSH and no du on page load.
Where
Header Reports (after Catalog). Phone: hamburger. Viewer+. No writes.
Windows: 7 / 30 / 90 days in the app timezone. Some averages still scan up to 365 days of leftover rows.
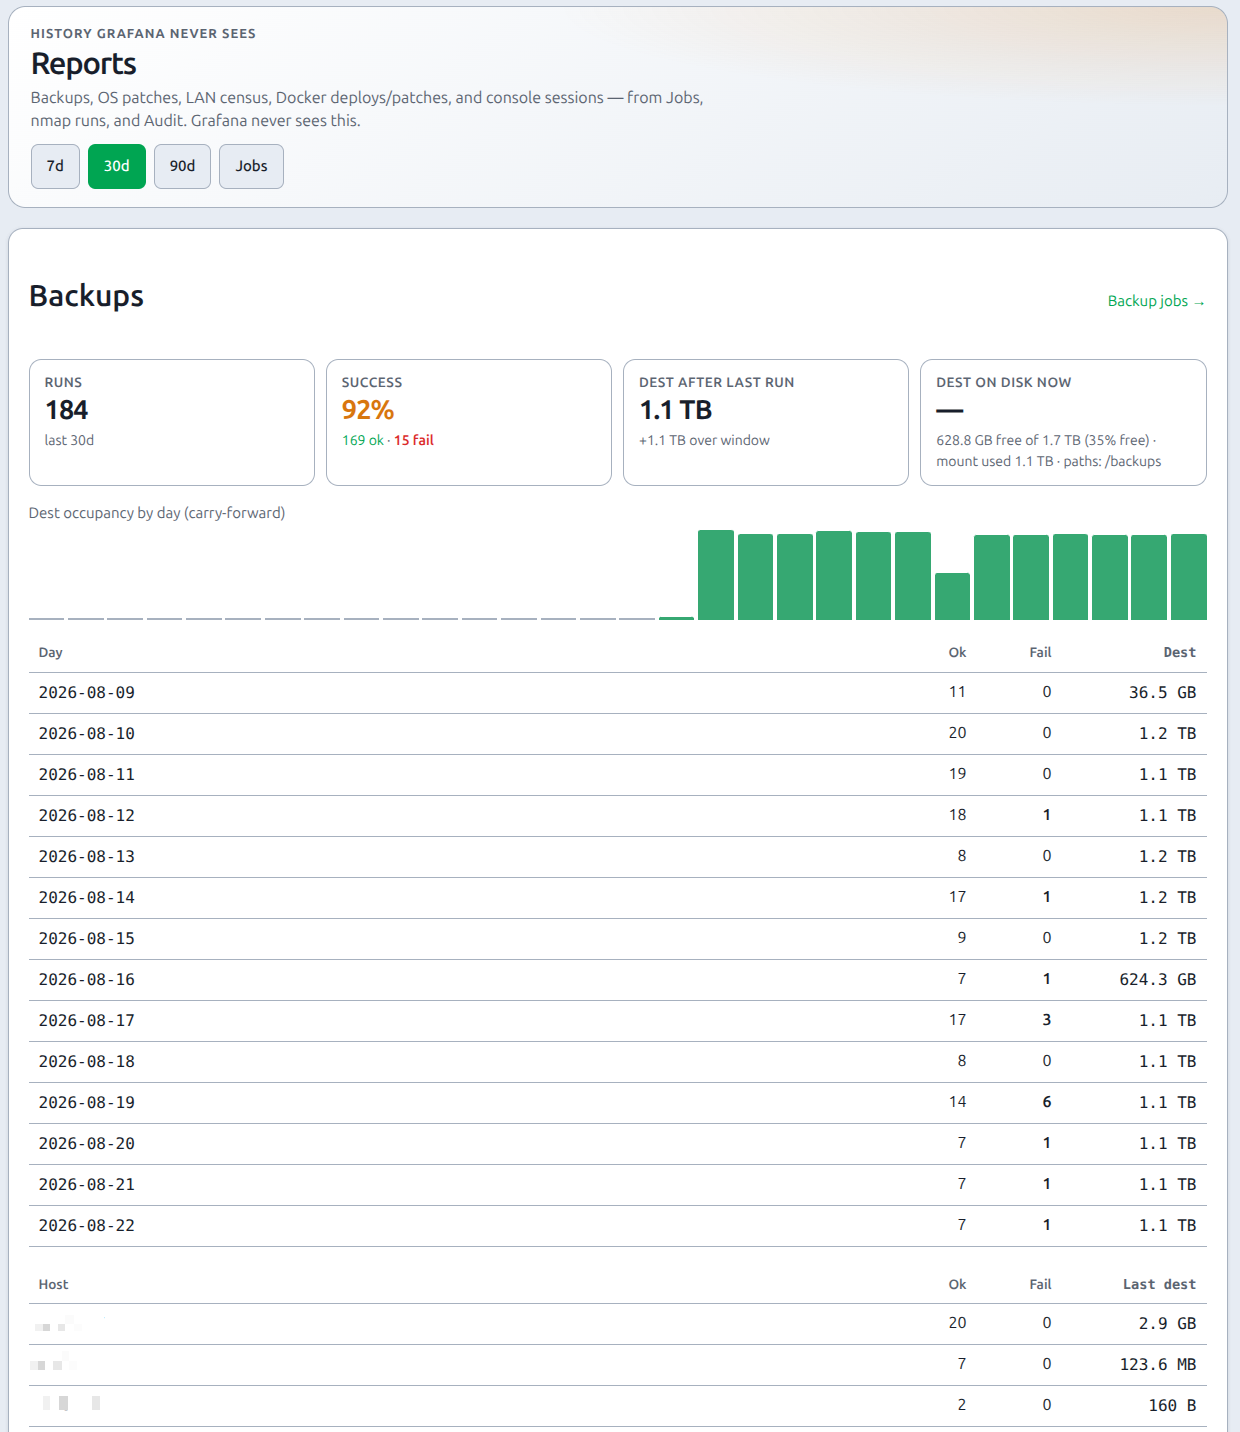
Tables keep numeric columns right-aligned. On a phone, the Day / host column is not clipped — swipe the table sideways to see dates and dest sizes.
Backups
| Figure | Meaning |
|---|---|
| Runs / success % | Finished backup jobs in the window |
| Dest after last run | Sum of each host’s last successful dest tree size (rsync destination after the run — not bytes transferred; unchanged files still count) |
| Dest occupancy by day | Same dest sizes, carried forward so a quiet day does not drop to zero — that is the growth sparkline |
| Dest on disk now | Last Settings → Status tree/du if one exists |
| Per host | Ok / fail / last dest → host Backups |
OS patches
| Figure | Meaning |
|---|---|
| Applies | Successful os_patch apply jobs (not update-checks) |
| Packages | Parsed from apt N upgraded, M newly installed when that line is in the job payload. Missing on HAOS and many older jobs |
| Average per host | Successful applies (and packages when known) ÷ hosts with OS patch enabled, for week (7d) / month (30d) / year (365d) |
LAN live
| Figure | Meaning |
|---|---|
| Live (last scan day) | hosts_up from the last successful nmap scan run that day (all LAN integrations summed) |
| By day | Same count carried forward when no scan ran |
| Average live | Mean / min / max of that daily occupancy for week / month / year |
| Catalog now | Current devices: live (new/known/linked) vs offline (stale) vs ignored — a snapshot, not history |
| First seen | Devices whose first_seen_at falls in the window |
Quiet days keep yesterday’s census. Overlapping CIDRs on two nmap integrations can double-count.
Docker
| Figure | Meaning |
|---|---|
| Stack deploys | docker_stack_deploy plus stop/start/restart and template deploy/redeploy |
| Image patches | container_patch apply jobs |
| Running now | Last Docker inventory snapshot (running / total / stacks) — not a daily census; we do not store container counts per day |
| Per day / host | Ok vs fail for deploys and patches |
Console
| Figure | Meaning |
|---|---|
| Sessions | ssh_console_open audit rows (works even when command audit is off) |
| Privileged | Opens whose identity is privileged:… |
| Duration | Sum of duration_sec on ssh_console_close |
| Denied | ssh_console_denied |
| Commands logged | ConsoleTranscript.command_count — only when Settings → Console audit is on |
Limits
- Job retention (Settings → Cleanup) deletes old Jobs. Default off; if you purge at 30 days, year averages only see 30 days.
- Audit purge (same Cleanup card) trims console session history.
- nmap run purge is a separate Cleanup switch (default off). LAN live uses
NmapScanRun, not Jobs. - No time-series database. This is a scan of existing rows.
- Not Grafana: no PromQL, no host CPU/RAM, no custom SQL, no export this freeze.