Dashboard & fleet Services
What this is
The Dashboard (/) is the home page after login: a fleet health at a glance view (hosts, attention, services down, alert count, maps pulse).
Reports (/reports, nav after Catalog) is history Grafana never sees: backups, OS patches, LAN live-per-day, Docker deploys/patches, console sessions — see Reports.
Fleet Services (/services) is a separate page: an icon grid of apps monitored via Uptime Kuma bindings.
Why it exists
Operators should not need to open every host to answer:
- How many hosts exist?
- Which ones need OS or container work?
- Are any watched services down or TLS-expiring?
- Where do I jump for network topology?
The dashboard answers those from last check jobs and caches (not a full SSH scan on every page load). Fleet Services exists so “apps that matter” are one filter away from Kuma, the host, or Docker.
End-to-end: first useful dashboard
- Add at least one server (Add a server).
- Run an OS or container update check if those features are on (Updates).
- Open
/— host count and attention table should reflect checks. - Optional: connect Uptime Kuma, bind monitors →
/servicesfills. - Optional: set host DNS / network settings → Network maps panel pulse moves off zero.
Done when: you can explain each tile without guessing, and empty Services is understood as “no Kuma binds yet” rather than a bug.
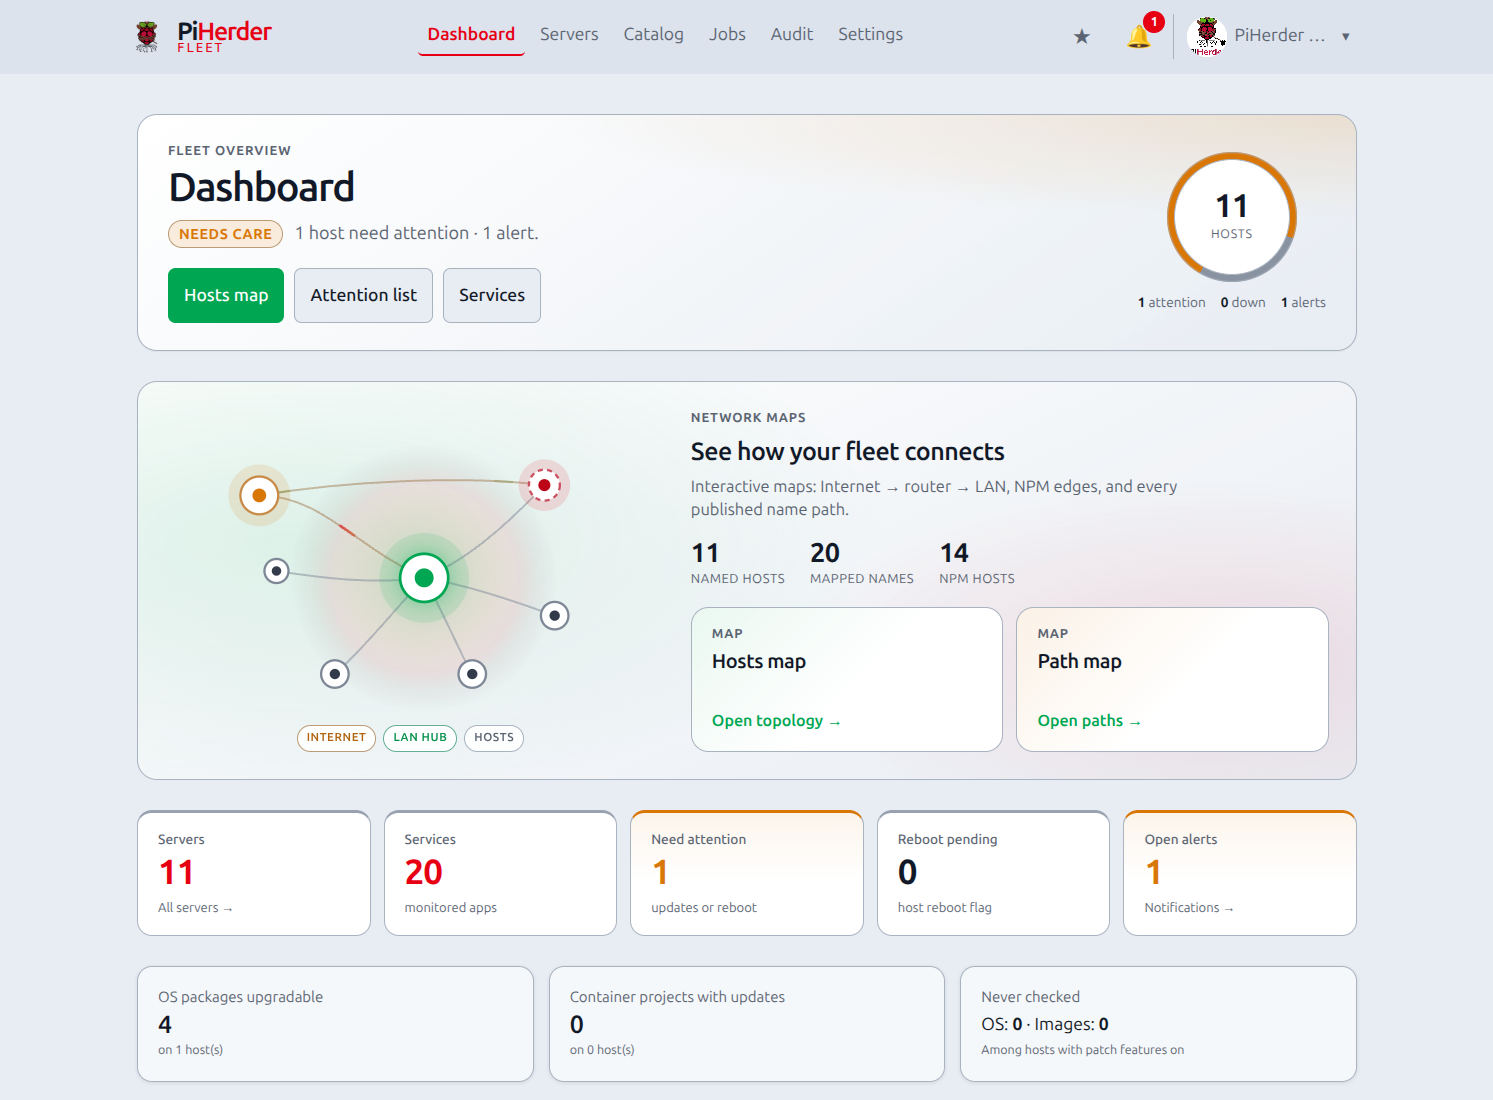
Dashboard (/)
| Tile / block | Meaning | Why it is there |
|---|---|---|
| Servers | Host count → Servers | Jump to the fleet list |
| Services | Monitored apps (Kuma bindings) → /services | Apps, not only hosts |
| Need attention | Hosts with OS/image updates or reboot pending | Work queue for the week |
| Reboot pending | Count of hosts flagging reboot-required | After kernel/OS upgrades |
| Open alerts | Inbox count → Notifications (bell) | Unread problems |
| OS / container summary cards | Aggregate package/image update counts | Fleet-wide patch pressure |
| Needs attention table | Only hosts that need work; Open / Docker shortcuts | Act without hunting |
| Network maps panel | Constellation + named/mapped/NPM counts | Homelab topology entry |
| Quick links | Reports (history), Servers, notifications, audit, Settings, Pi-hole, Certificates, Catalog | Frequent destinations |
| Hosts map / Path map links | /dns/physical#map · /dns/logical#map | Open the SVG graph (not list-only) |
Status comes from last check jobs (and related caches) — not continuous SSH on every open. The Network maps panel uses a cheap pulse (counts only), not a full SVG build.
Pins & host jump
For multi-host fleets, pin frequent pages with the ★ next to feature titles / Network map cards, then open them from the header ★ menu. On a host feature page, use Jump host to stay on Docker/Backups/Services/Files while switching machines. Full guide: Pins & host jump. Host Files button appears when PIHERDER_HOST_FILES=true (Host Files).
| Pulse field | Source |
|---|---|
| Named hosts | Fleet servers with dns_name set |
| Mapped names | ServiceDnsRecord rows |
| NPM hosts | Sum of NPM integration poll proxy_host_count (matches Catalog → NPM detail; not only DNS via_proxy flags — the edge hostname itself is often via_proxy=false) |
Fleet Services (/services)
Fleet-wide view of Uptime Kuma service bindings (host service or Docker project/container). Uses the shared ops-hero (up / down / TLS pulse) plus filter chips and search.
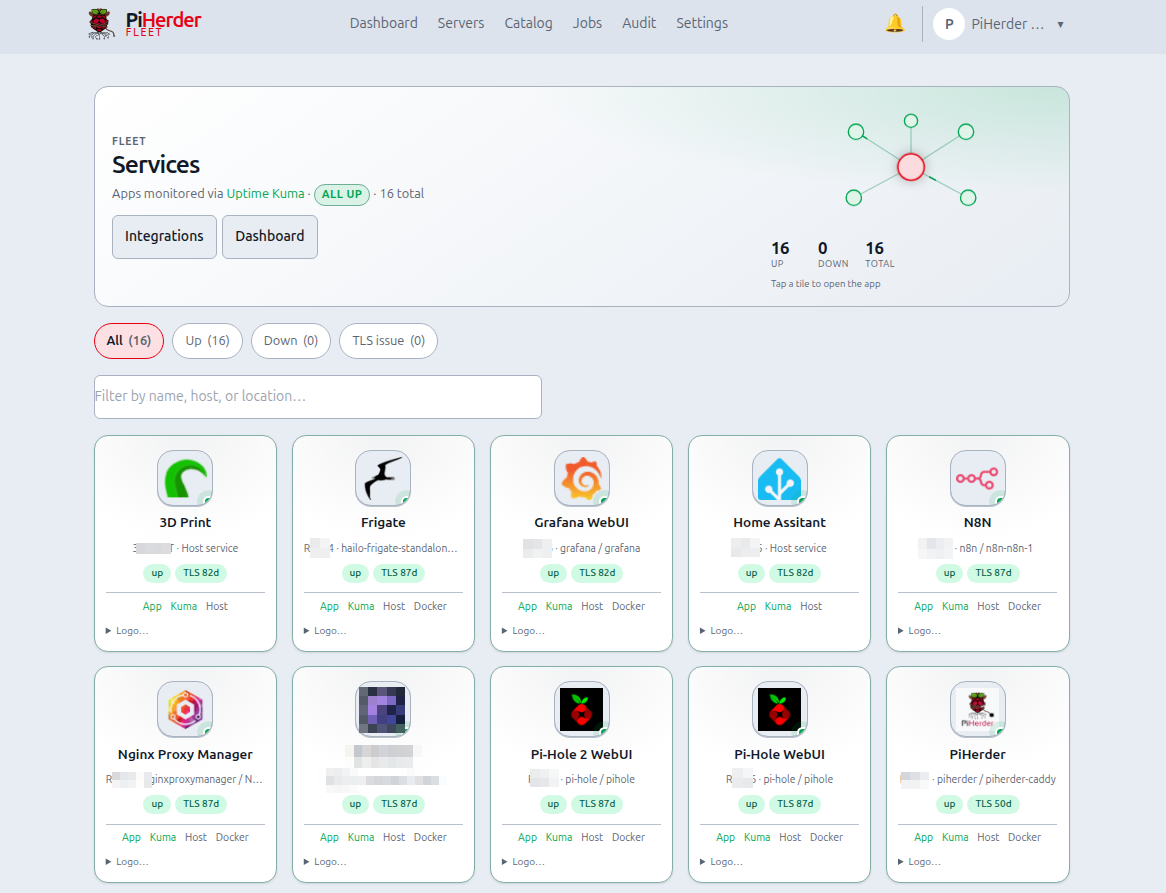
| Feature | Use |
|---|---|
| Filter | All · Up · Down · TLS issue |
| Search | Name, host, location |
| App | Open service URL (if set) — primary open-app tile |
| Kuma | Open monitor in Kuma |
| Host | Per-server services page |
| Docker | Host Docker page when binding is a stack |
| Logo… | Upload, fetch favicon, or remove (operator+) |
On narrow viewports, service rows stack metadata and actions vertically so controls stay tappable (no horizontal squash).
Empty grid
If you see “No fleet services yet”:
- Connect Uptime Kuma.
- Bind HTTP/HTTPS monitors as service (or use Suggest matches).
- Return to
/servicesor the Dashboard Services tile.
Per-host view: Server → Services (/servers/{id}/services) — same card pattern and mobile stacking for that host only.
Related
- Reports — backup dest, OS patches, LAN census, Docker deploys, console sessions
- Updates & patching — what “attention” means
- Jobs, audit & notifications
- Uptime Kuma
- Network maps